Volatility ETF Decay and Reverse Splits: A Practical Monitoring Tool (VXX, UVXY, VIXY)
Volatility ETF Decay and Reverse Splits
Volatility ETFs such as VXX, VIXY, and UVXY behave very differently from traditional equity ETFs.
While most investors expect prices to reflect long-term growth or market cycles, these products are structurally designed to decay over time.
Understanding why this happens — and how it leads to reverse splits — is essential if you are trading or analyzing volatility products.
Why do volatility ETFs decay?
Volatility ETFs track short-term VIX futures, not the VIX index directly.
To maintain exposure, they must continuously roll futures contracts, typically from the front month to the next one.
In most market conditions, this rolling process happens in contango, meaning:
- longer-dated futures are more expensive
- the ETF systematically sells low and buys high
Over time, this creates a persistent negative drift in price.
This is known as volatility decay.
What is a reverse split in VXX, UVXY and VIXY?
Because of this decay, the price of these ETFs trends downward over time.
To keep the price within a tradable range, issuers periodically perform reverse splits.
For example:
- a 1-for-4 reverse split multiplies the price by 4
- but reduces the number of shares accordingly
Importantly:
Reverse splits do not create value — they only reset the price scale.
These events are not random. They occur when the price approaches certain structural levels.
Introducing the Split Monitor tool
To better understand and track this process, I built a tool that monitors:
- the raw (unadjusted) price of each ETF
- historical reverse split levels
- the distance to those levels
- an estimate of time to the next split based on decay
👉 Open the interactive dashboard
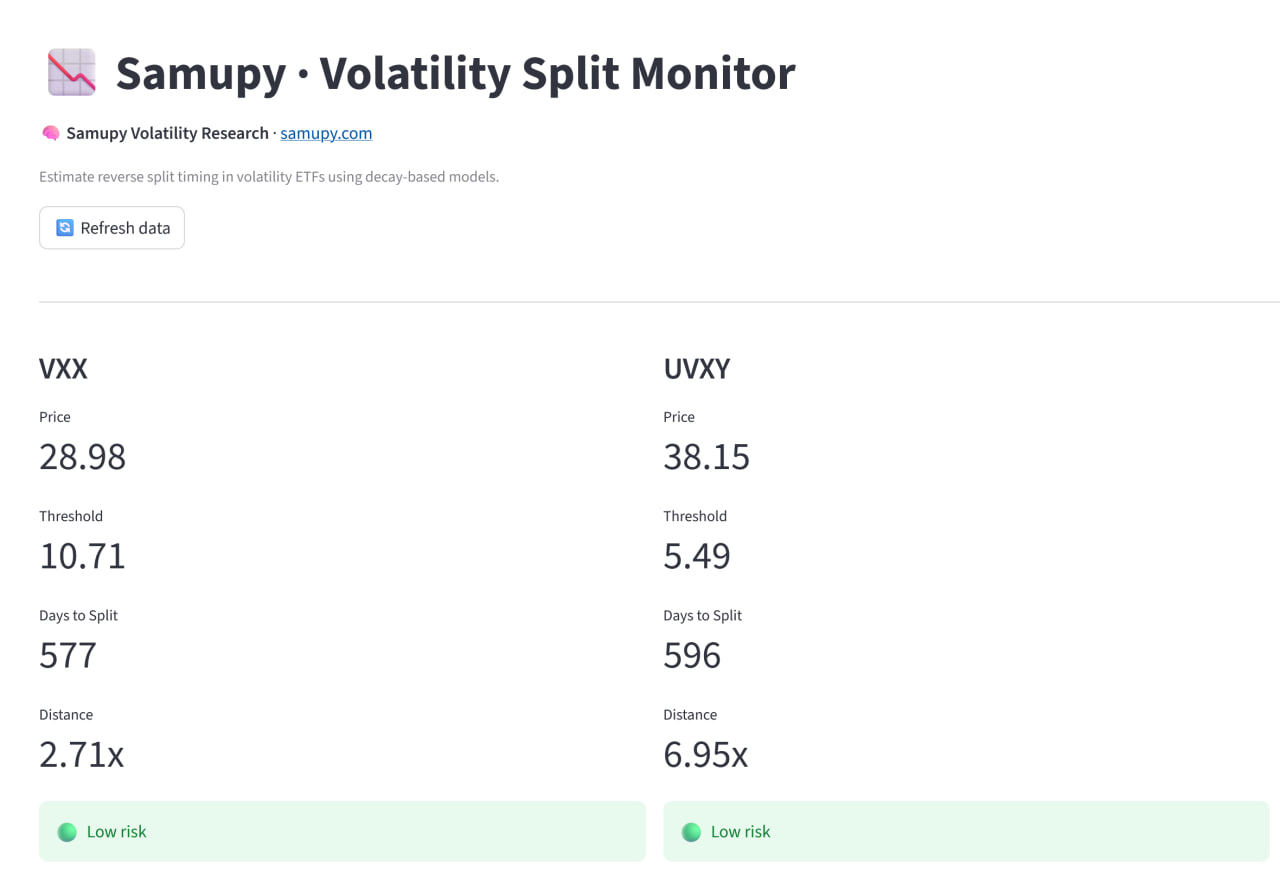
Interactive dashboard showing decay, thresholds and estimated time to next split.
How the tool works
The model behind the tool is intentionally simple and robust:
- reconstructs historical prices without split adjustments
- identifies typical price levels where splits occurred
- estimates current decay using empirical data
- projects forward assuming exponential decay
This allows for a practical approximation of when the next structural reset may happen.
Key metrics explained
Days to Split
Estimated number of days until the ETF reaches its typical reverse split level.
Distance to Threshold
Ratio between current price and historical split level.
- ~1.0x → high risk
- higher values → more buffer
Risk Indicator
A qualitative classification based on estimated timing:
- 🔴 High → short-term risk
- 🟡 Medium → intermediate horizon
- 🟢 Low → far from split levels
Practical applications
This tool is not meant to predict markets, but to provide structural context.
Some practical uses include:
1. Understanding decay regimes
Identify when volatility ETFs are in strong decay vs temporary stabilization.
2. Risk awareness
Monitor proximity to reverse splits, which often coincide with prolonged decay phases.
3. Strategy context
Provide additional context for strategies involving:
- long volatility exposure
- short volatility trades
- hedging instruments
4. Market structure insight
Reverse splits reflect underlying futures dynamics and term structure conditions.
Limitations
- Assumes a relatively stable decay regime
- Does not account for sudden volatility spikes
- Not a predictive model in a strict sense
This is a structural tool, not a trading signal generator.
Final thoughts
Volatility ETFs are often misunderstood.
By tracking decay and reverse splits explicitly, it becomes easier to interpret their behavior and avoid common pitfalls.
Tools like this help shift the perspective from price movements to underlying mechanics.